Explore Custom Map Integrations for Your User Journeys

Remember life before Google Maps and Apple Maps? It was….harder. The advent of digital maps has changed the way we search, travel, and investigate the world around us. Your website should integrate these learnings for a richer, more data-driven user experience.
There Are Many Ways To Use Maps to Improve Your Website
You’ve likely seen many of these examples in action as you’ve browsed various websites. Maps, at the broadest level, contextualize the story you are telling on your website. They answer one of the key components of any story, known colloquially as the 5 W’s: who, what, when, WHERE, and why.
Some of the most common and useful applications for integrated maps fall into two broad categories — navigation and data visualization. These can include showing the location of your office or offices, highlighting geographies where you provide services, or creating a compelling asset to showcase your work. From there, the array of data you can showcase through various filters and overlays is practically limitless.
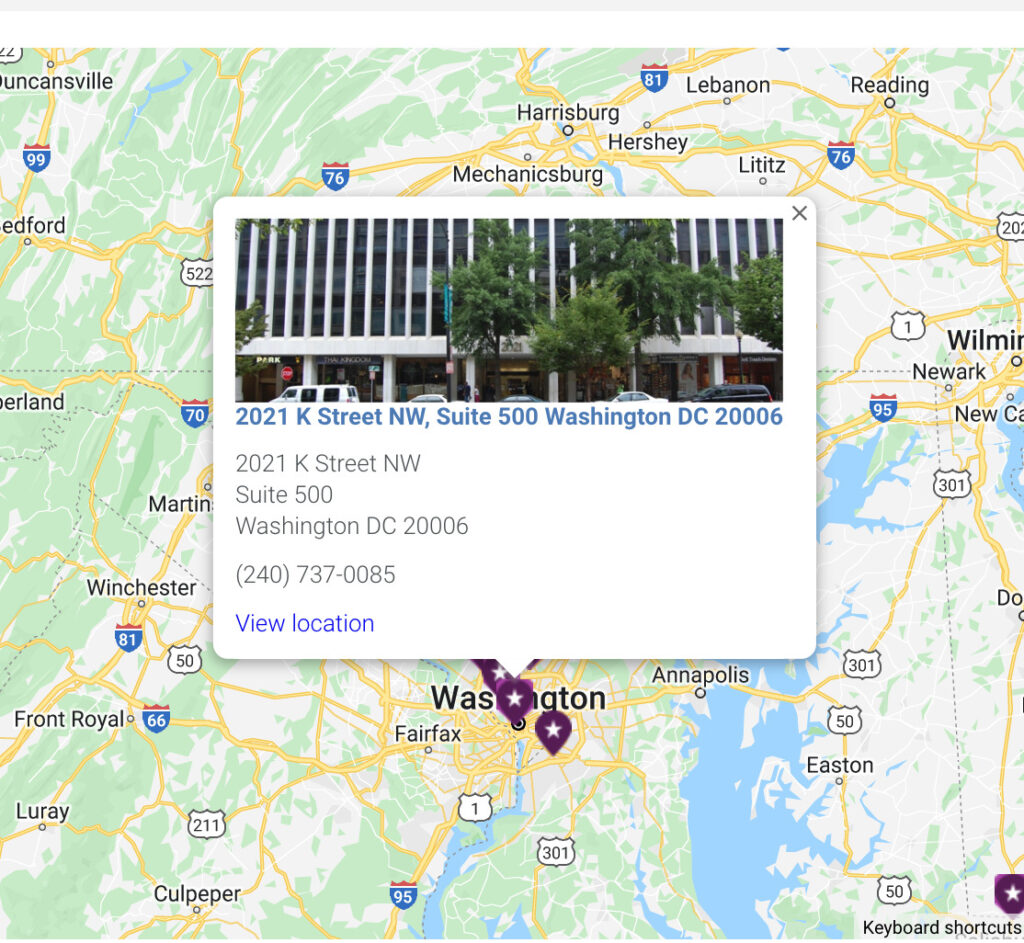
Google Maps API
One popular plug and play map integration is the Google Maps API. Capital Digestive Care used the Google Maps API to display its office locations. This is mapping at its most straightforward– a classic pin dropped on the ubiquitous Google Map with a pop up to show the street view and location.
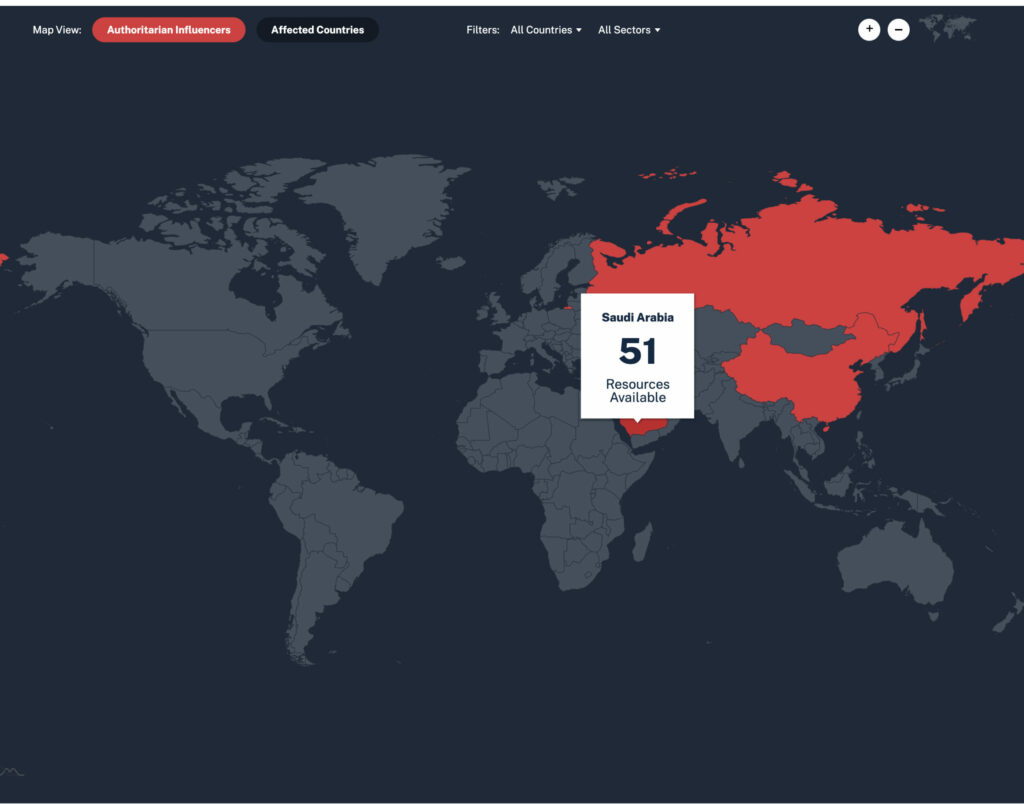
amCharts
A great option, especially for WordPress sites, is amCharts. If you have a lot of unique resources across various locales, this will allow you to drill down into the post types and taxonomies for a deeper dive. This offers standard country and regional maps but can be customized.
It also has built-in animations that the National Endowment for Democracy’s research portal Sharp Power taps into for a great user experience.
The United States Institute of Peace uses amCharts for customized zooming from within certain sub regions and for filtering by passing country data from its Drupal database into the amCharts script.
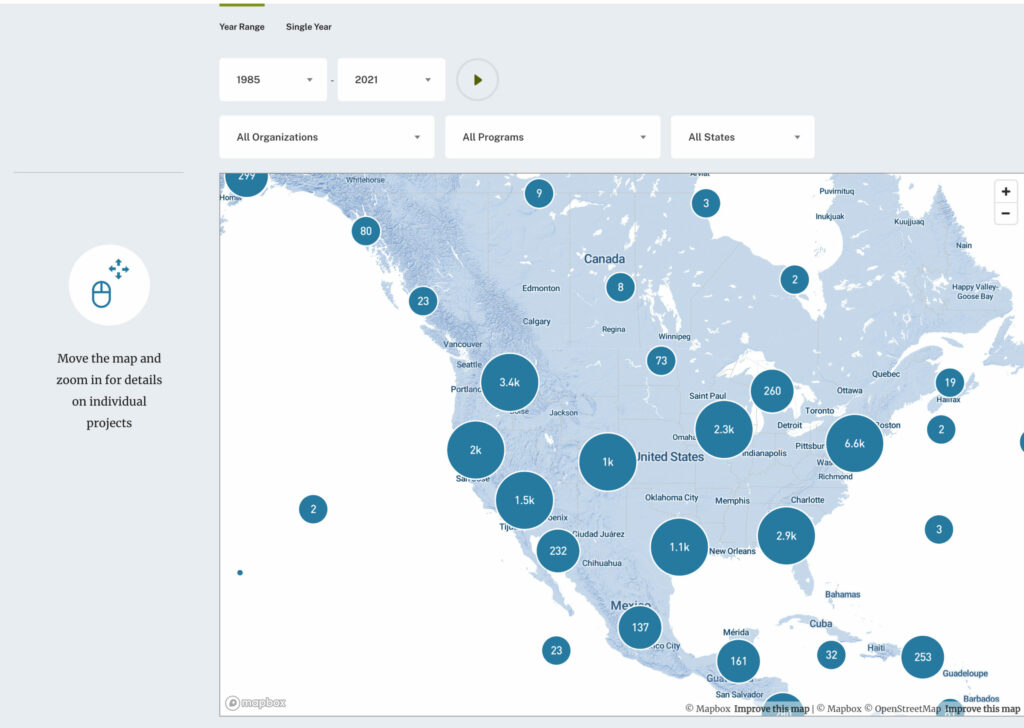
Mapbox
Mapbox is a great tool for visualizing clusters, and it’s actually free to use for up to 50k monthly loads! After that, a credit card is required, but it’s a great way to test the waters. Mapbox also has a developer platform (Mapbox Studio) that enables you to pull in base maps, apply layers, and add color styles.
The National Fish and Wildlife Foundation uses a Mapbox integration to show users where in the world their work is taking place.
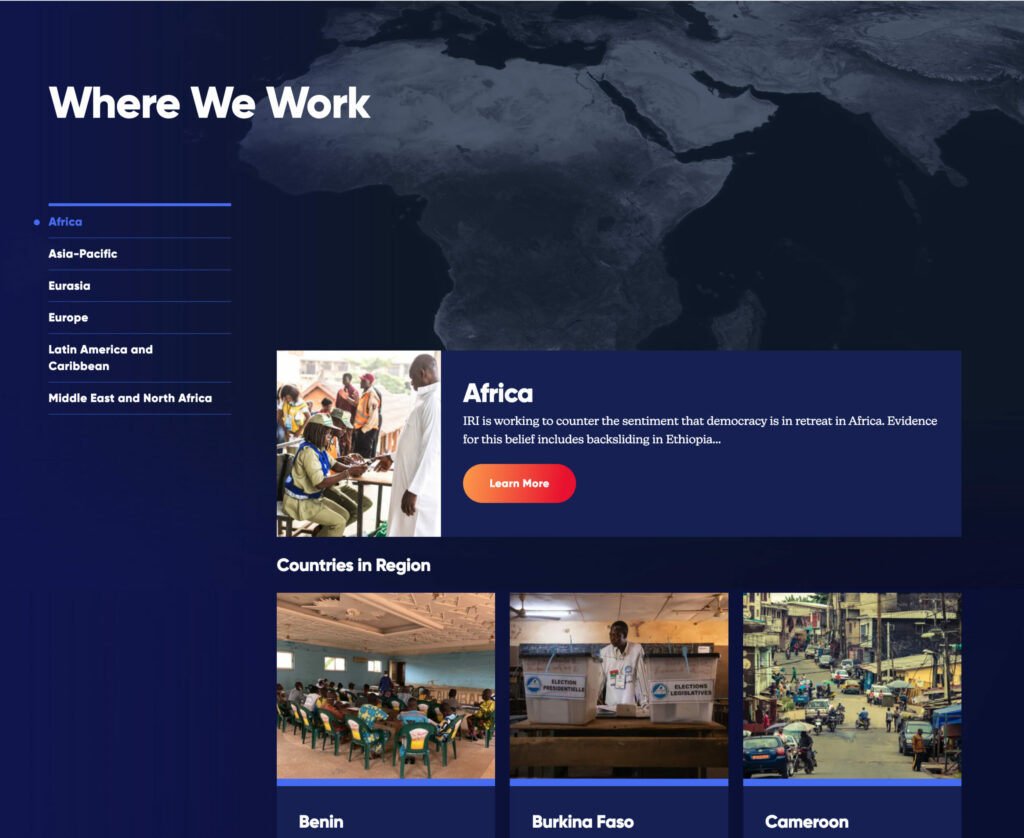
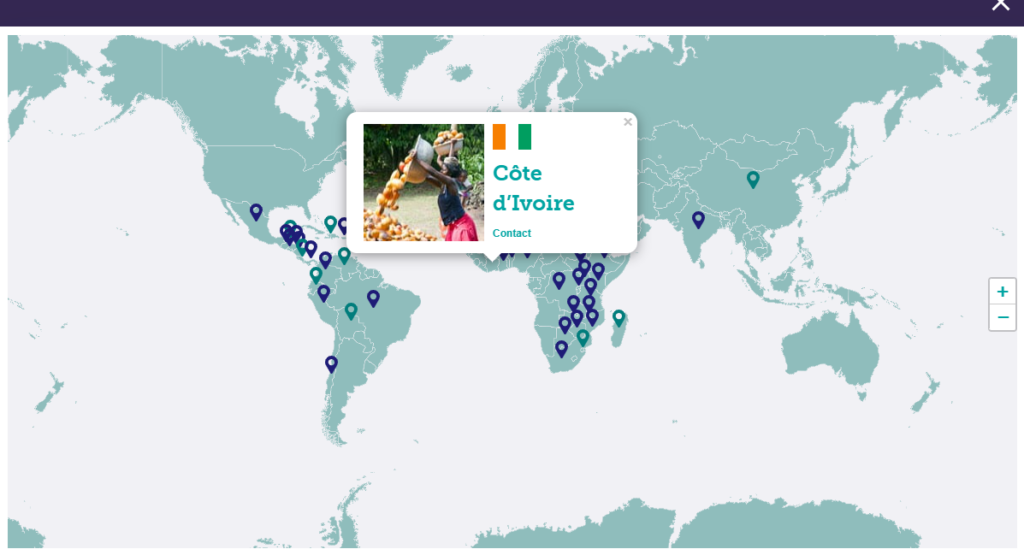
Another beautiful application in Mapbox is the Fly-to function on the International Republican Institute website. This visualization can overlay photographs to help personalize the user experience and introduce a human element into your map integration.
Custom Map Integrations
If you cannot find exactly what you need through these map integrations, a custom map can be built to your specifications. Most of these are what’s known as an SVG — a scalable vector graphic — which is an image format for defining 2D graphics with the potential for interactivity and animation.
Here are a few examples
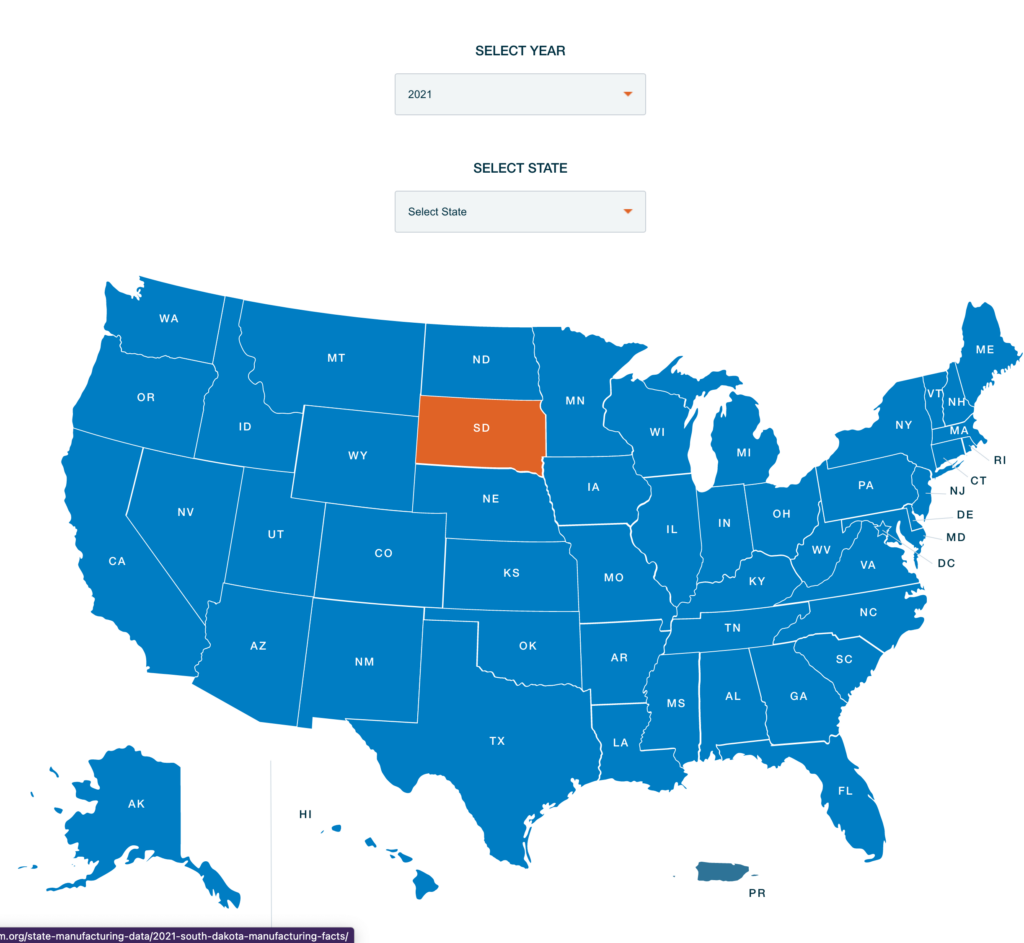
This custom map for the National Association of Manufacturers lets you tap into state-level data, which creates posts. If two data points shown here are associated (state/year), both the filters and the map are updated to add links to the corresponding post.
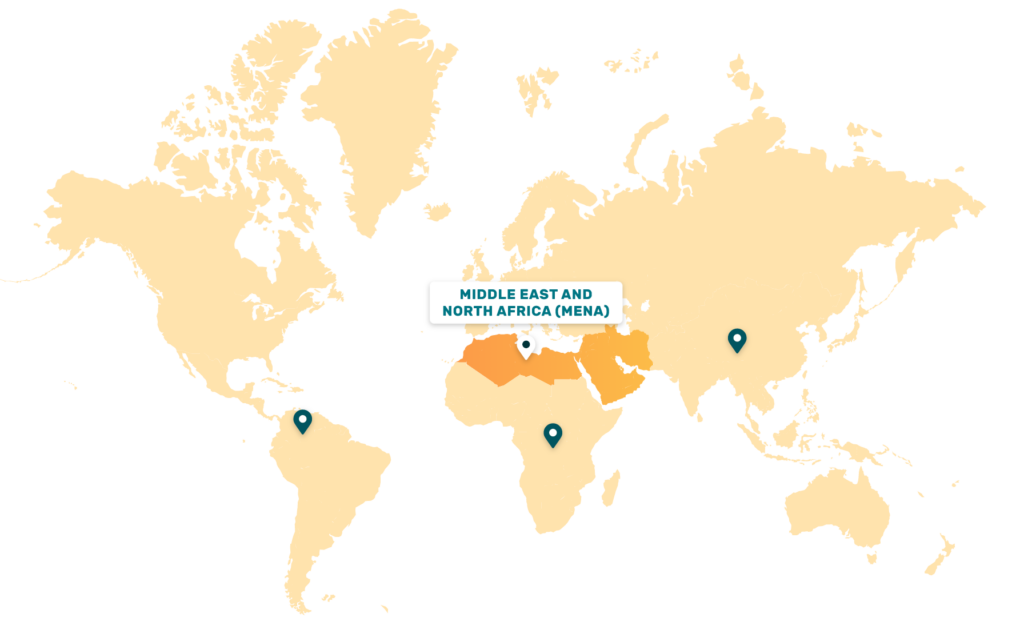
FSN Network features a simple, zoomed out map with visual indicators of the locations where they work. Each region includes a navigation link to associated webpages for more info.
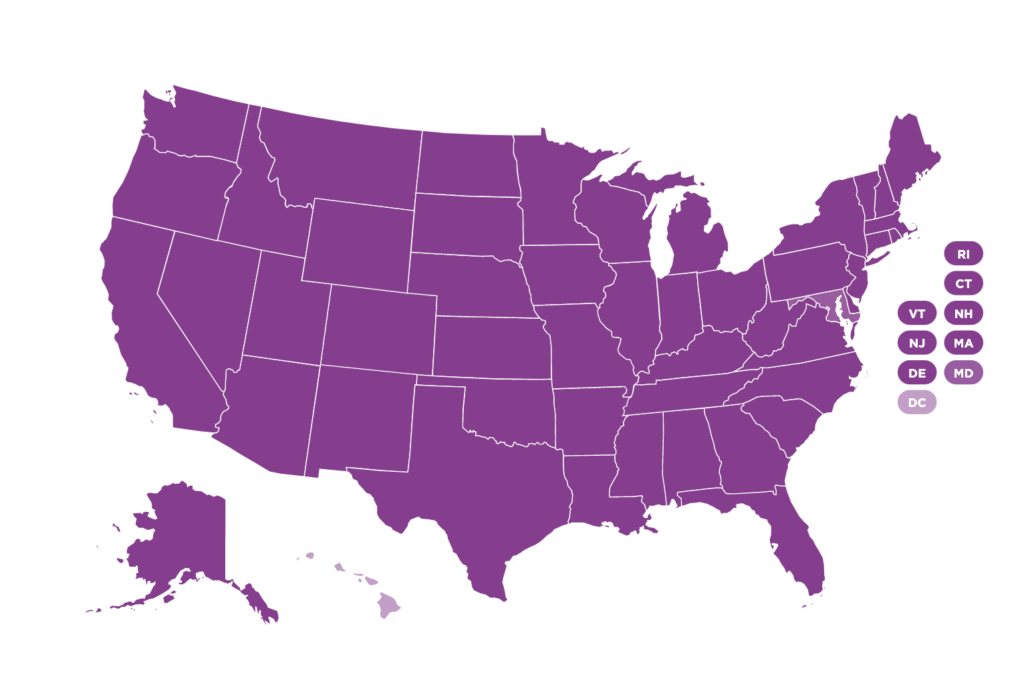
For the National League of Cities, the data provided by a custom post type was designed to hold contact info for each state. During the build, the SVG data was split up to make it easier to attach custom data to each state.

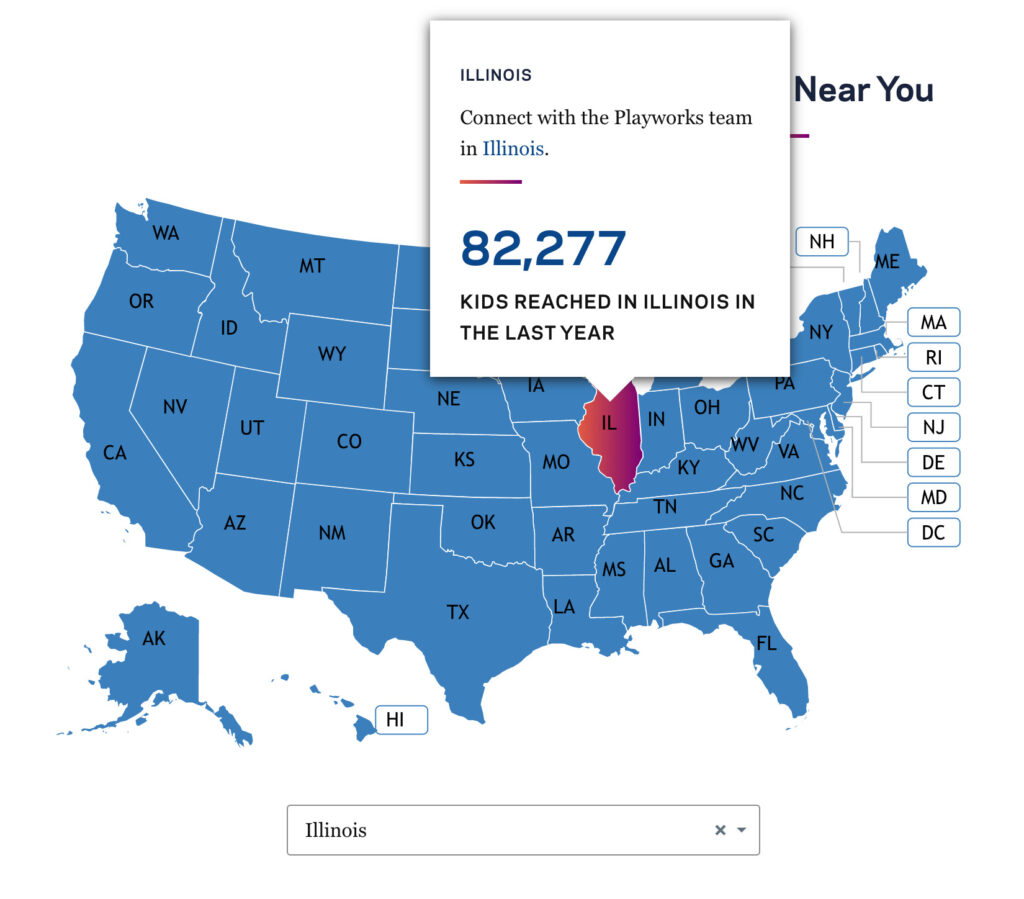
A custom map for Playworks is designed to show highly specific info at a glance and in an easy to digest format. To build this, our team built out a popover functionality for a great user experience and beautiful data visualization.
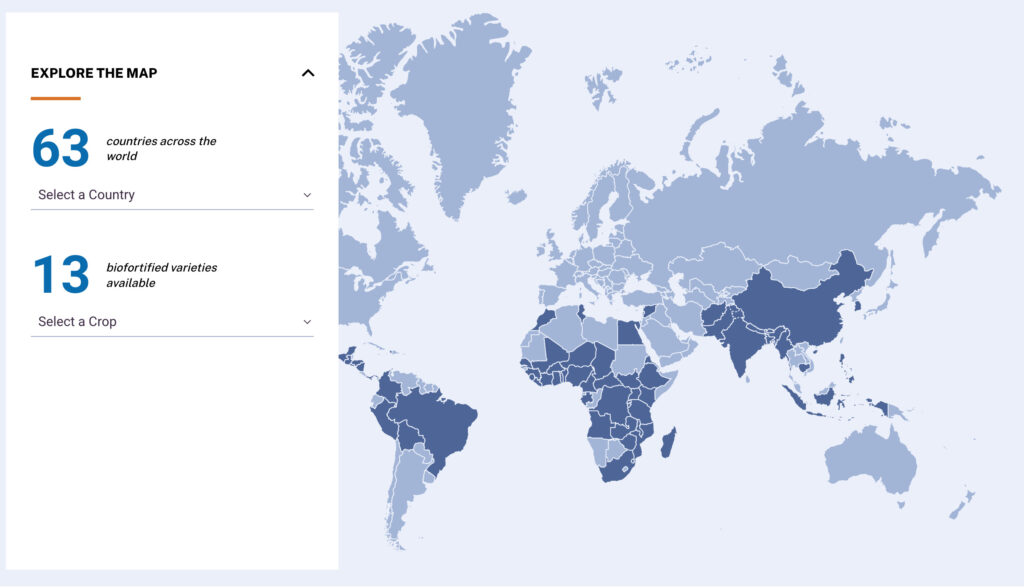
An interactive map for HarvestPlus updates information as you use it. This loops through WordPress custom post types to add all the necessary data for each. If data for a country exists, it highlights on the map. Upon crop click, countries are highlighted based on type. And upon country click, custom zooming functionality takes place and displays the associated data.
Navigating a Web Redesign with Map Integrations
As you can see, there are many beautiful ways to bring your data to life with a map integration. In today’s world, customers want and expect interactive and compelling data visualization that make their experience on your website more engaging, more thorough and simply better overall.
For more on the conversation about map integrations with WDG, watch the Lunch & Learn presentation.
Here are more examples of our clients who are using map integrations on their WordPress sites
The National League of Cities Covid-19 Response & Relief Local Action Tracker
![]()
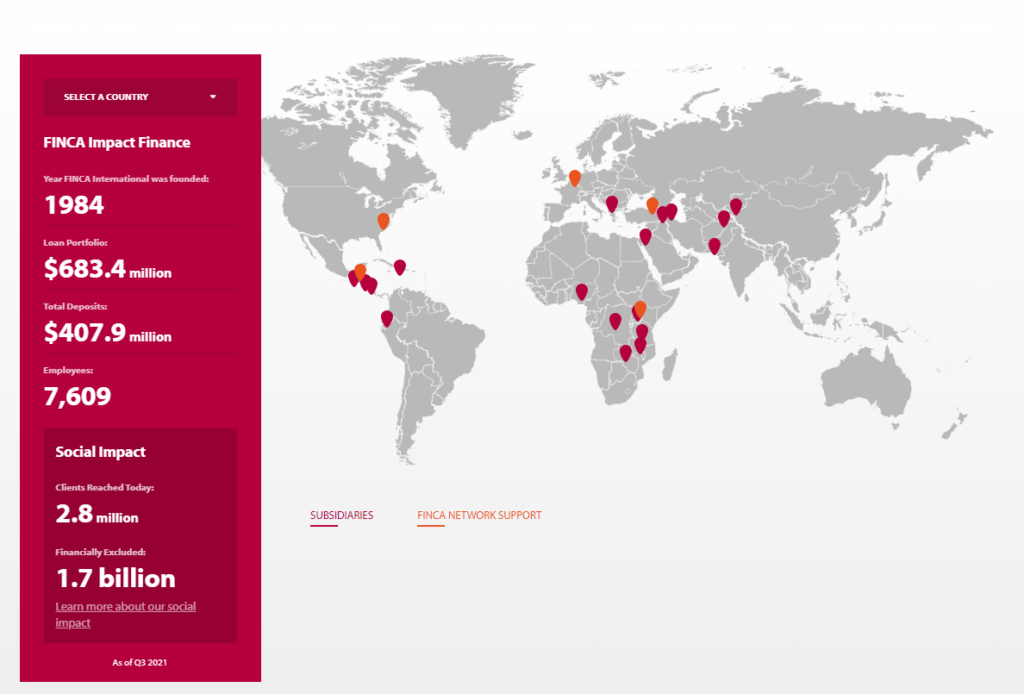
FINCA Impact Finance global subsidiary and network support map
TechnoServe’s work locations map with pop-up overlays
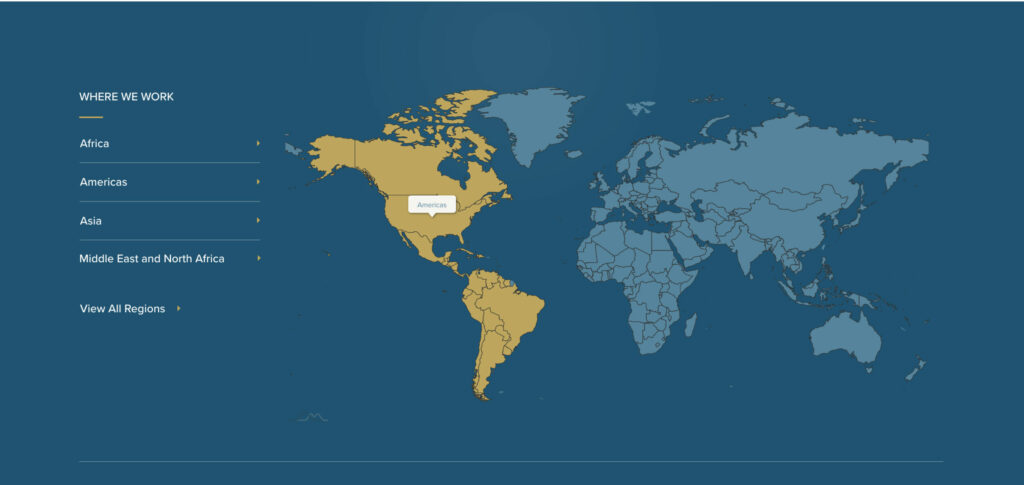
Chemonics Where We Work regional locations map
Interested in a custom map integration for your business? Reach out to us today at webdevelopmentgroup.com/contact/.
And don’t forget to check out WDG Senior Developer Amanda Blake’s Lunch & Learn presentation on how we’ve worked with clients to build out custom map integrations as a part of their website redesign.