Debugging Performance Early Using New Relic
A huge part of building websites is debugging performance issues. As a rule of thumb, the earlier you start diagnosing performance pain points, the better you’ll be.
At The Web Development Group, using performance tools helps us diagnose our work with speed. Today, I’m going to walk you through one of the tools we use and how it has helped us deliver results.
Identifying the Problem
First, a little context.
As WDG has grown, we rely more on services that optimize our work. Think about your own workflow. Do you use compilers for CSS like SASS or LESS? How about task management services like Asana or Trello? Do you automate deployment with Beanstalk or Pantheon? These tools lead to greater efficiency all around.
A couple years ago, we were collaborating on a large WordPress project. We realized each team member had different tools they used to debug. Each toolset had strengths and weaknesses, but none gave the whole picture. While pain points were identified, the question was what do we do about it?
New Relic: Be a Better Debugger
Enter New Relic. Their tagline sums up their business goals, “Don’t trust the cloud.” Ha! While the cloud may not lie, it doesn’t give you the whole picture when using a grab bag of tools to debug.
New Relic, however, provides app, browser, server, and database monitoring over time in one dashboard. We set up New Relic on every new project as soon as we begin development. New Relic starts collecting statistics immediately, which we can use as a baseline.
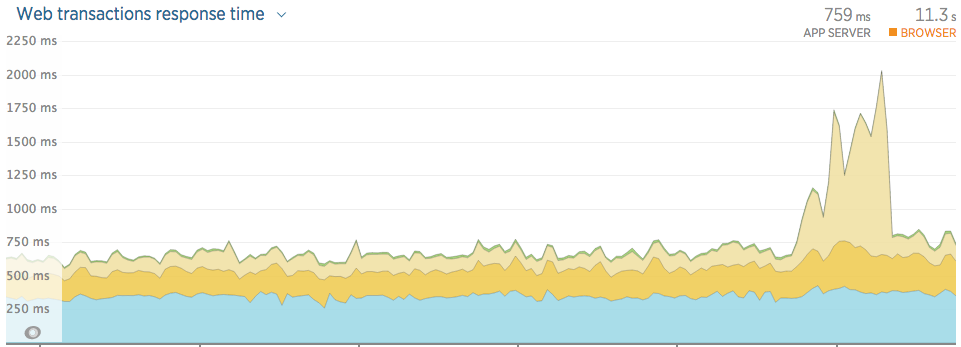
As we release new features, we get immediate feedback on how it performs. We watch error rates, database traffic, server response time, and even page rendering time.

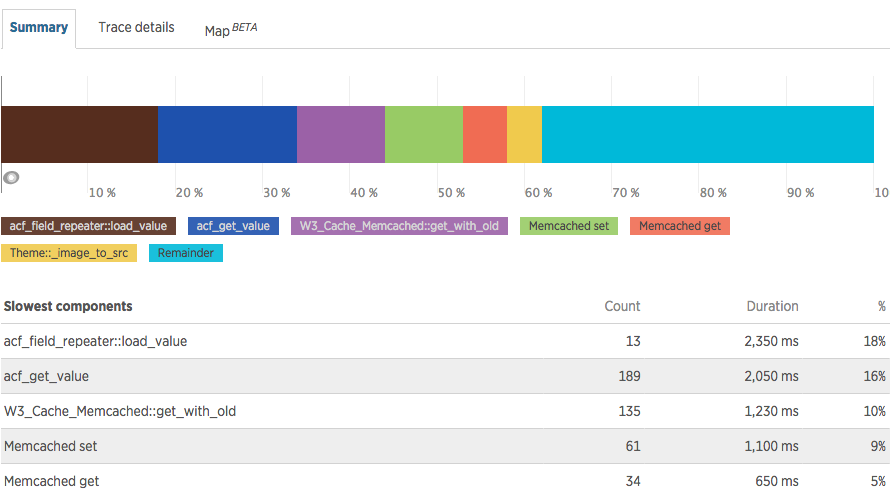
For problematic transactions, we can drill down into the segments taking the longest. Each of these transactions has a list of traces in order of longest response time.

For a complete picture, switch over to the browser tab. The Browser view lets you look at how your release is affecting page rendering time.

For the sake of this blog post, we’ll end there. New Relic also provides automated user testing, uptime monitoring, and customizable dashboards. Pretty neat stuff.
New Relic in Practice
I know what you are thinking, “That all sounds wonderful, but how is this going to help me?” I’m going to show how we used New Relic on WTOP to give you a taste. I really recommend signing up for New Relic’s free trial to see its capacity.
We used New Relic from the beginning, but it was most vital right before release. The staging environment was set up to use Varnish and APC for caching. The server architecture had many web nodes and separate replicated servers for the database.
We migrated the codebase and data over to the new environment. Then, we set up W3 Total Cache to make use of APC. New Relic helped us identify queries that were not getting cached and fix these.
Once we were happy with the results we were getting, we flooded the site with traffic. Since we integrated Varnish with New Relic, we were able to identify slowdowns from cache misses. Usually, the sources of these sorts of performance issues are hard to identify. With New Relic’s dashboard, we were quick to find the source of these issues.
A process we built was importing content on the backend. New Relic helped us identify differences in the environment, causing the process to hang. This may have slipped without a view of the whole picture of our environment.

New Relic helped us identify pain points before launch to prevent subpar user experiences. What we learned changed our approach to the server technology and architecture. For example, we added memcache to our caching setup to help serve content faster. WTOP went on to have record-breaking spikes in traffic without breaking a sweat.
Summing It Up
If you find you or your team struggles to debug your projects, I recommend you test performance early and often. I also recommend using New Relic to speed and improve this process.
New Relic provides both a historical and realtime views of performance metrics. These performance metrics include the application, database, server-side technologies like Varnish, and browser rendering. You can access general stats on the fly before drilling into specifics. All this content is available in one, clean dashboard.
Our Development Setup
In case you want more information on our setup, here’s a rundown.
- We use git for version control with Beanstalk for the repository and deployment. All our work is completely on a local machine before pushing to Beanstalk.
- We build most projects on WordPress or Drupal. For that reason, we make use of a typical LAMP stack.
- BlackMesh hosts our development environment and many of our clients. Production environments usually make use of Varnish with APC and sometimes Memcache and Gluster.
- New Relic has integrations with every aspect of our setup: Apache, Mysql, PHP, Varnish, APC, Memcache, and more.


